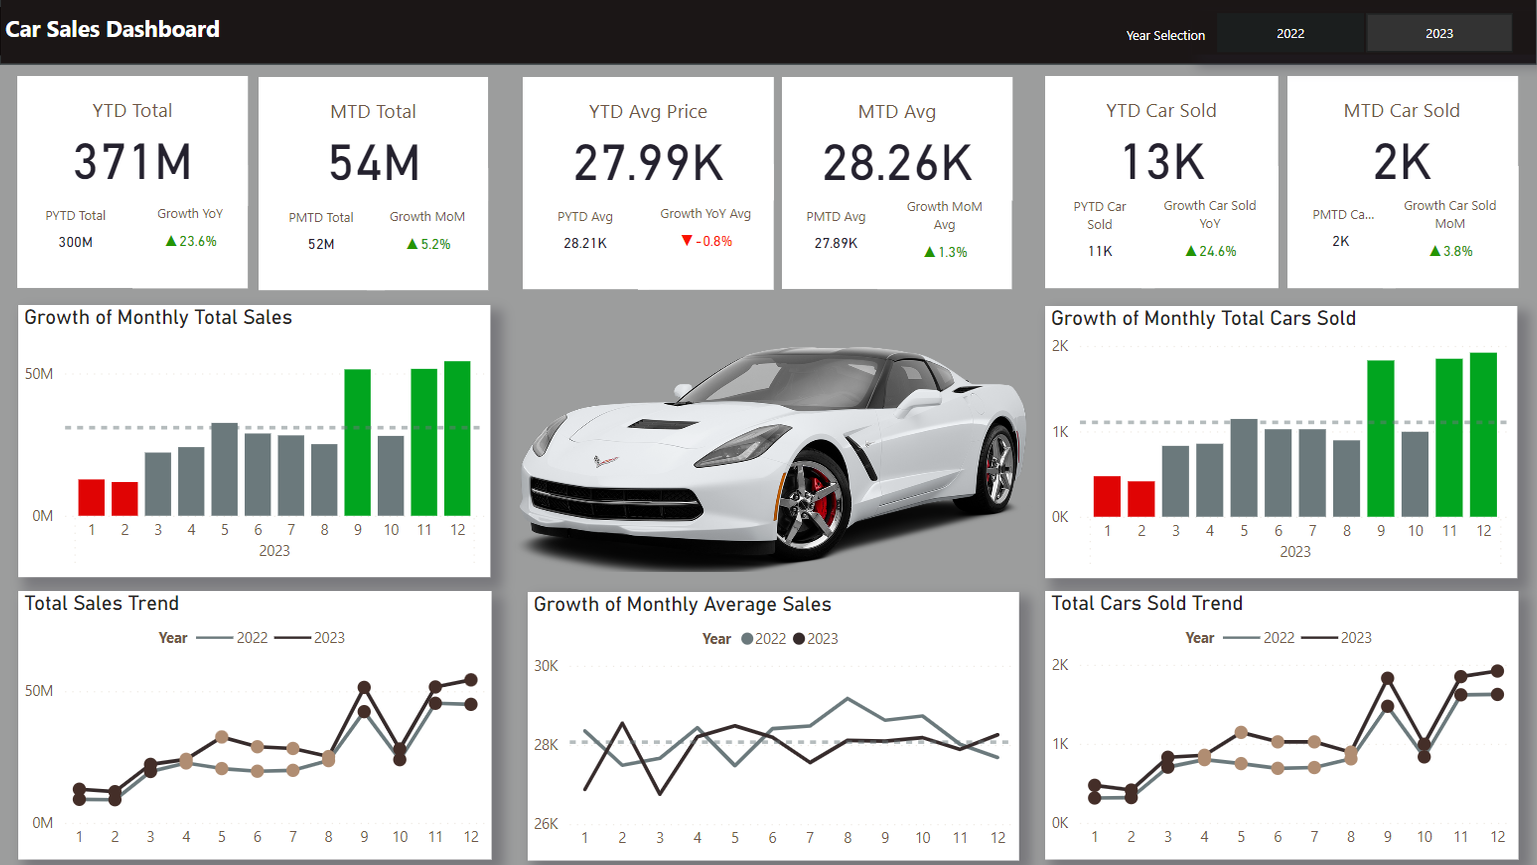
Automotive sales tracking
I used Excel and Power BI to visualize critical KPIs related to the dealers' car sales. This helped them to understand their sales performance over time and make data-driven decisions.
Explore other Power BI Dashboards


Welcome to my portfolio, featuring projects from my professional work, university studies, and personal explorations within my areas of interest.
I used Excel and Power BI to visualize critical KPIs related to the dealers' car sales. This helped them to understand their sales performance over time and make data-driven decisions.
Explore other Power BI Dashboards
The dynamic dashboard was developed on Tableau to provide an overview of listing activity across the area and a price analysis.
Explore other Tableau dashboards
I used Python to develop and visualize an analysis on the top hits recorded by Spotify, giving insights into users preferences across years.
Explore other dashboards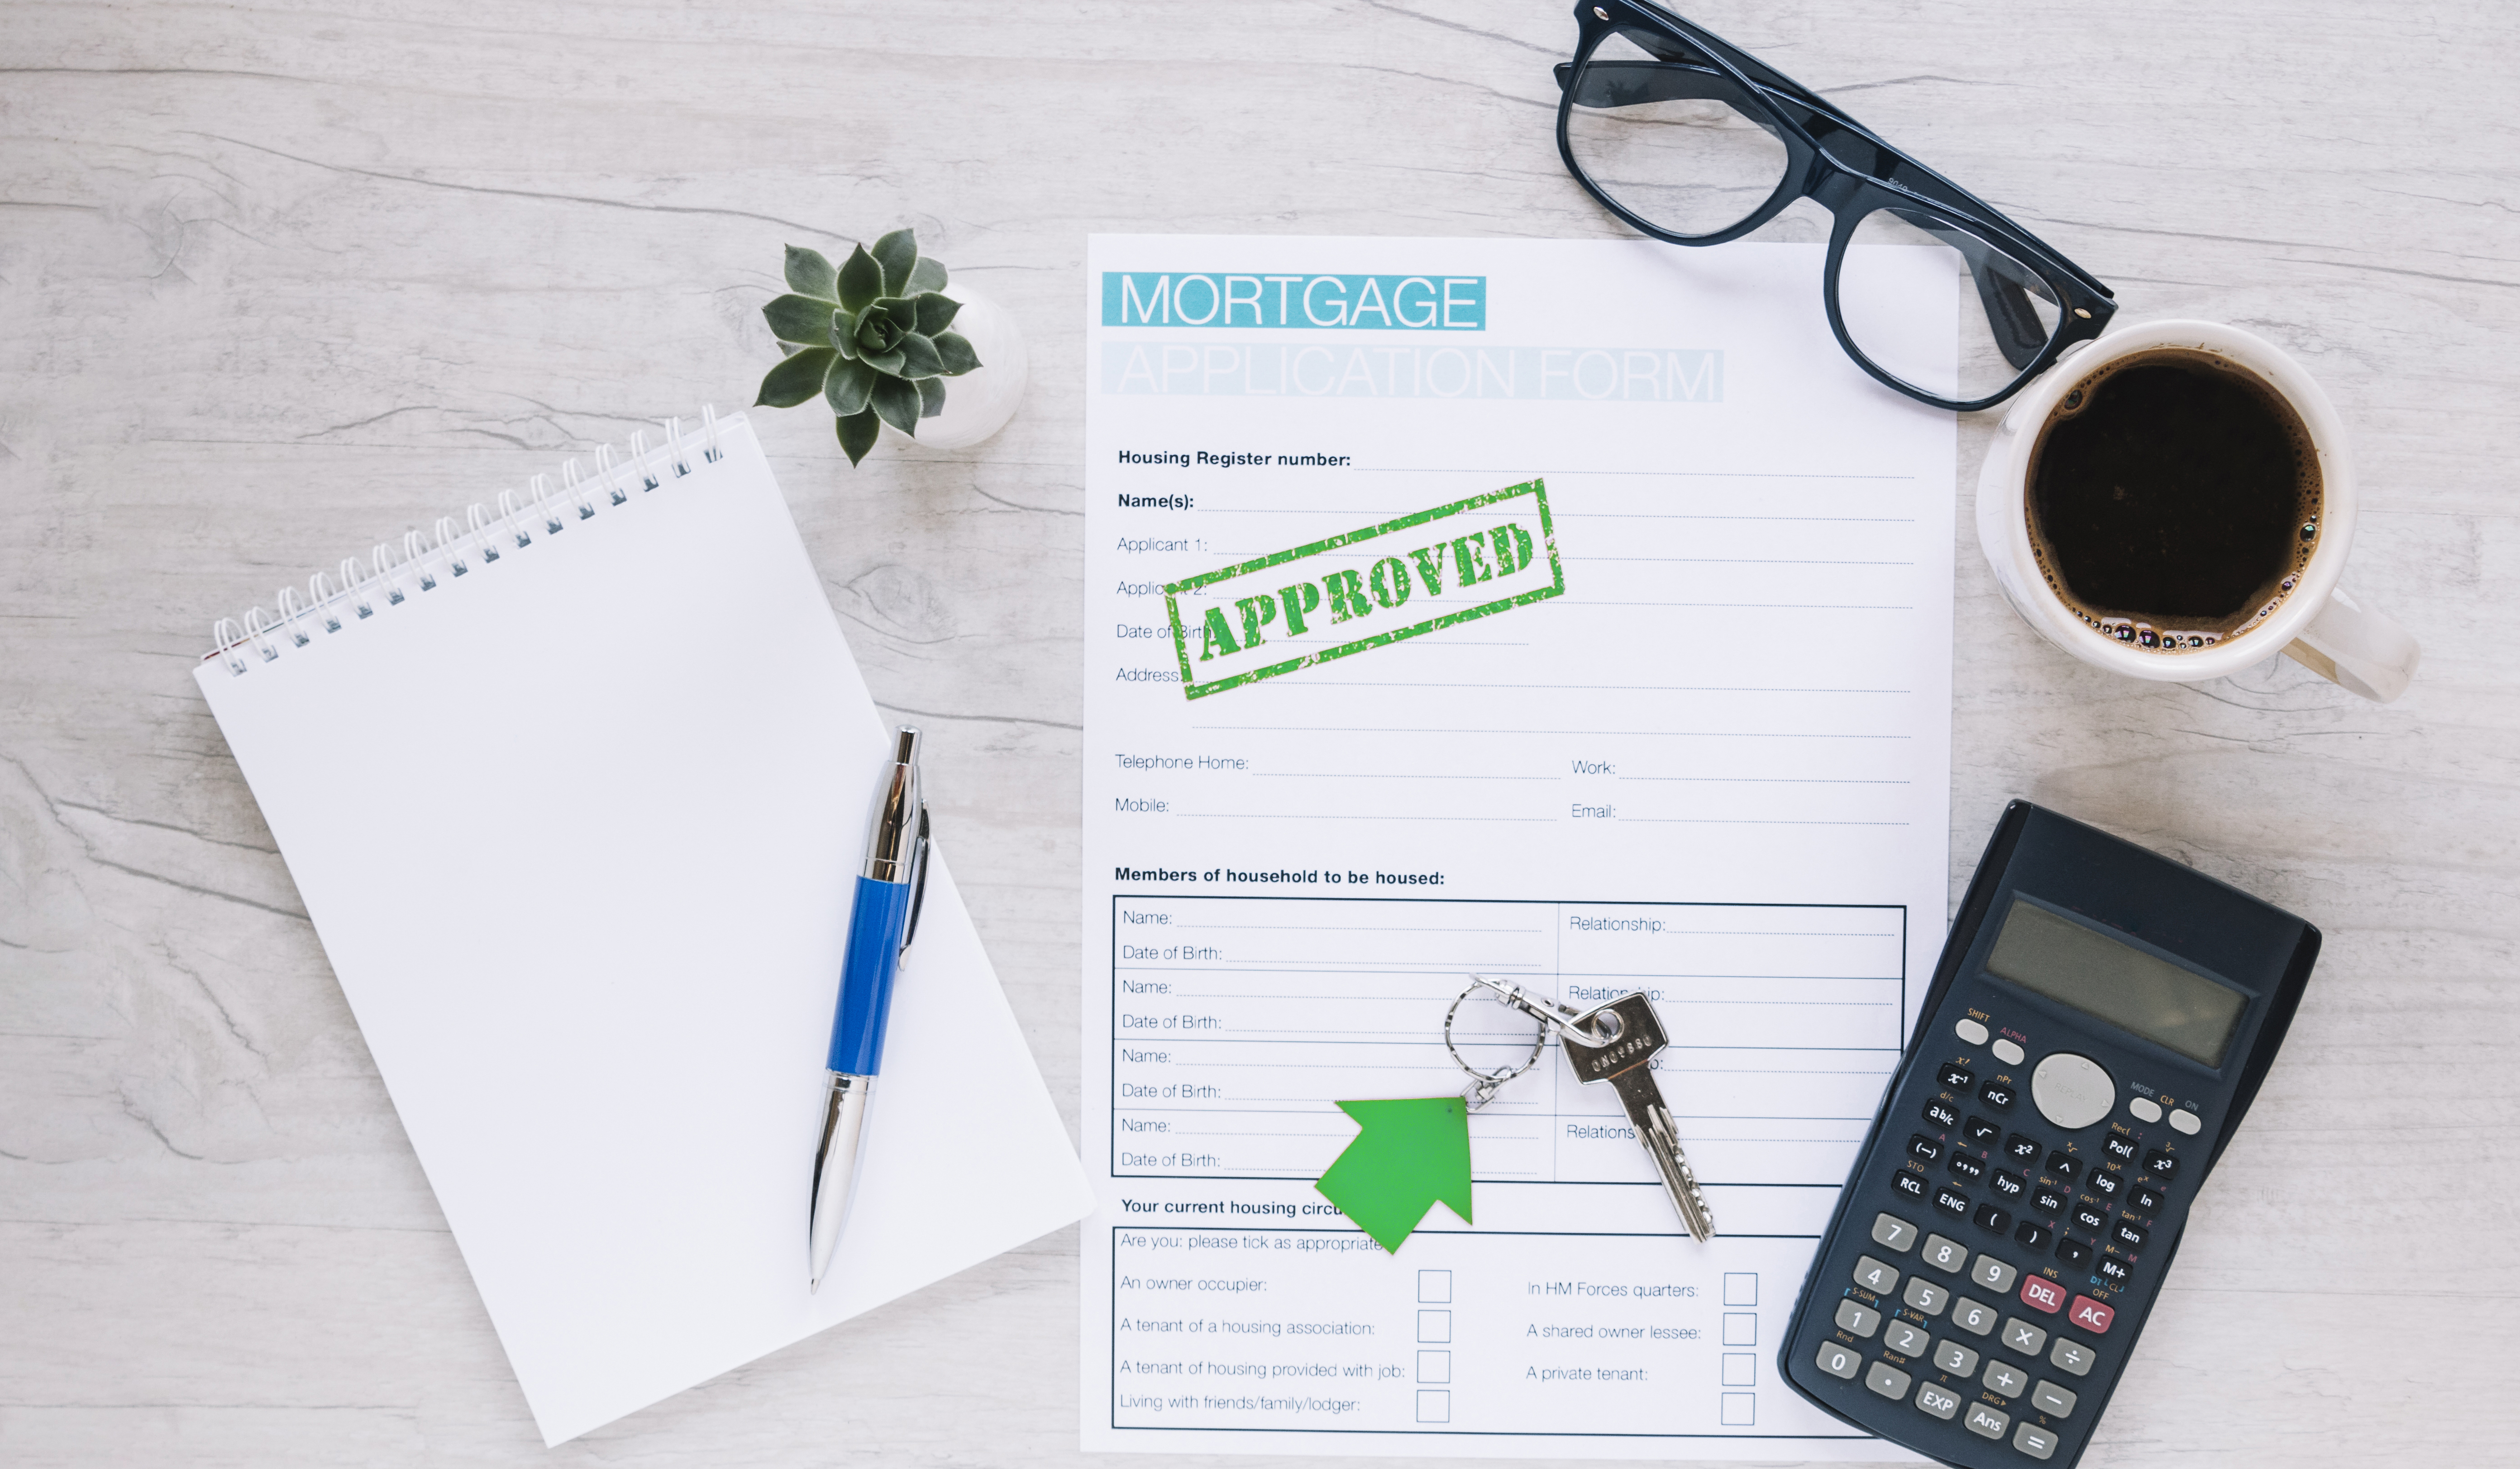
The project used WEKA (Machine Learning algorithms) to conduct 3 methods of classification (KNN, Neural Network and Naïve Bayesian). The outcome is an automation model which can facilitate loan qualifying procedures for home buyers.
Explore other dashboards